Inside COT Screener
The screener: filter markets by positioning
The market pages read one market deeply. The screener works the other way: it starts from every major market and narrows the field until what remains deserves your attention.
Every week produces the same question. Out of dozens of markets, which ones moved in a way worth opening? The screener answers it with a ranked table and two rows of controls. The screenshots show the reporting week of August 4, 2026.
Scope first: what to compare
The first row sets the universe. A search field matches market names. The asset class menu limits the table to one class, from equity indices to livestock. The trader group menu decides whose positioning you are ranking: large speculators, commercials or small traders. The lookback sets the window the COT Index is scored against, six months, one year or three years.
Scope changes what the numbers mean. The same market can read 90 against six months and 40 against three years. The screener makes that explicit instead of hiding it behind one fixed window.
Criteria second: what counts as interesting
The second row narrows the field. A COT Index range keeps only markets inside the bounds you type. The extremes toggle jumps straight to long extremes at 80 and above, or short extremes at 20 and below. The weekly move filter keeps markets whose main group added or reduced, with a minimum size in percentage points of open interest.
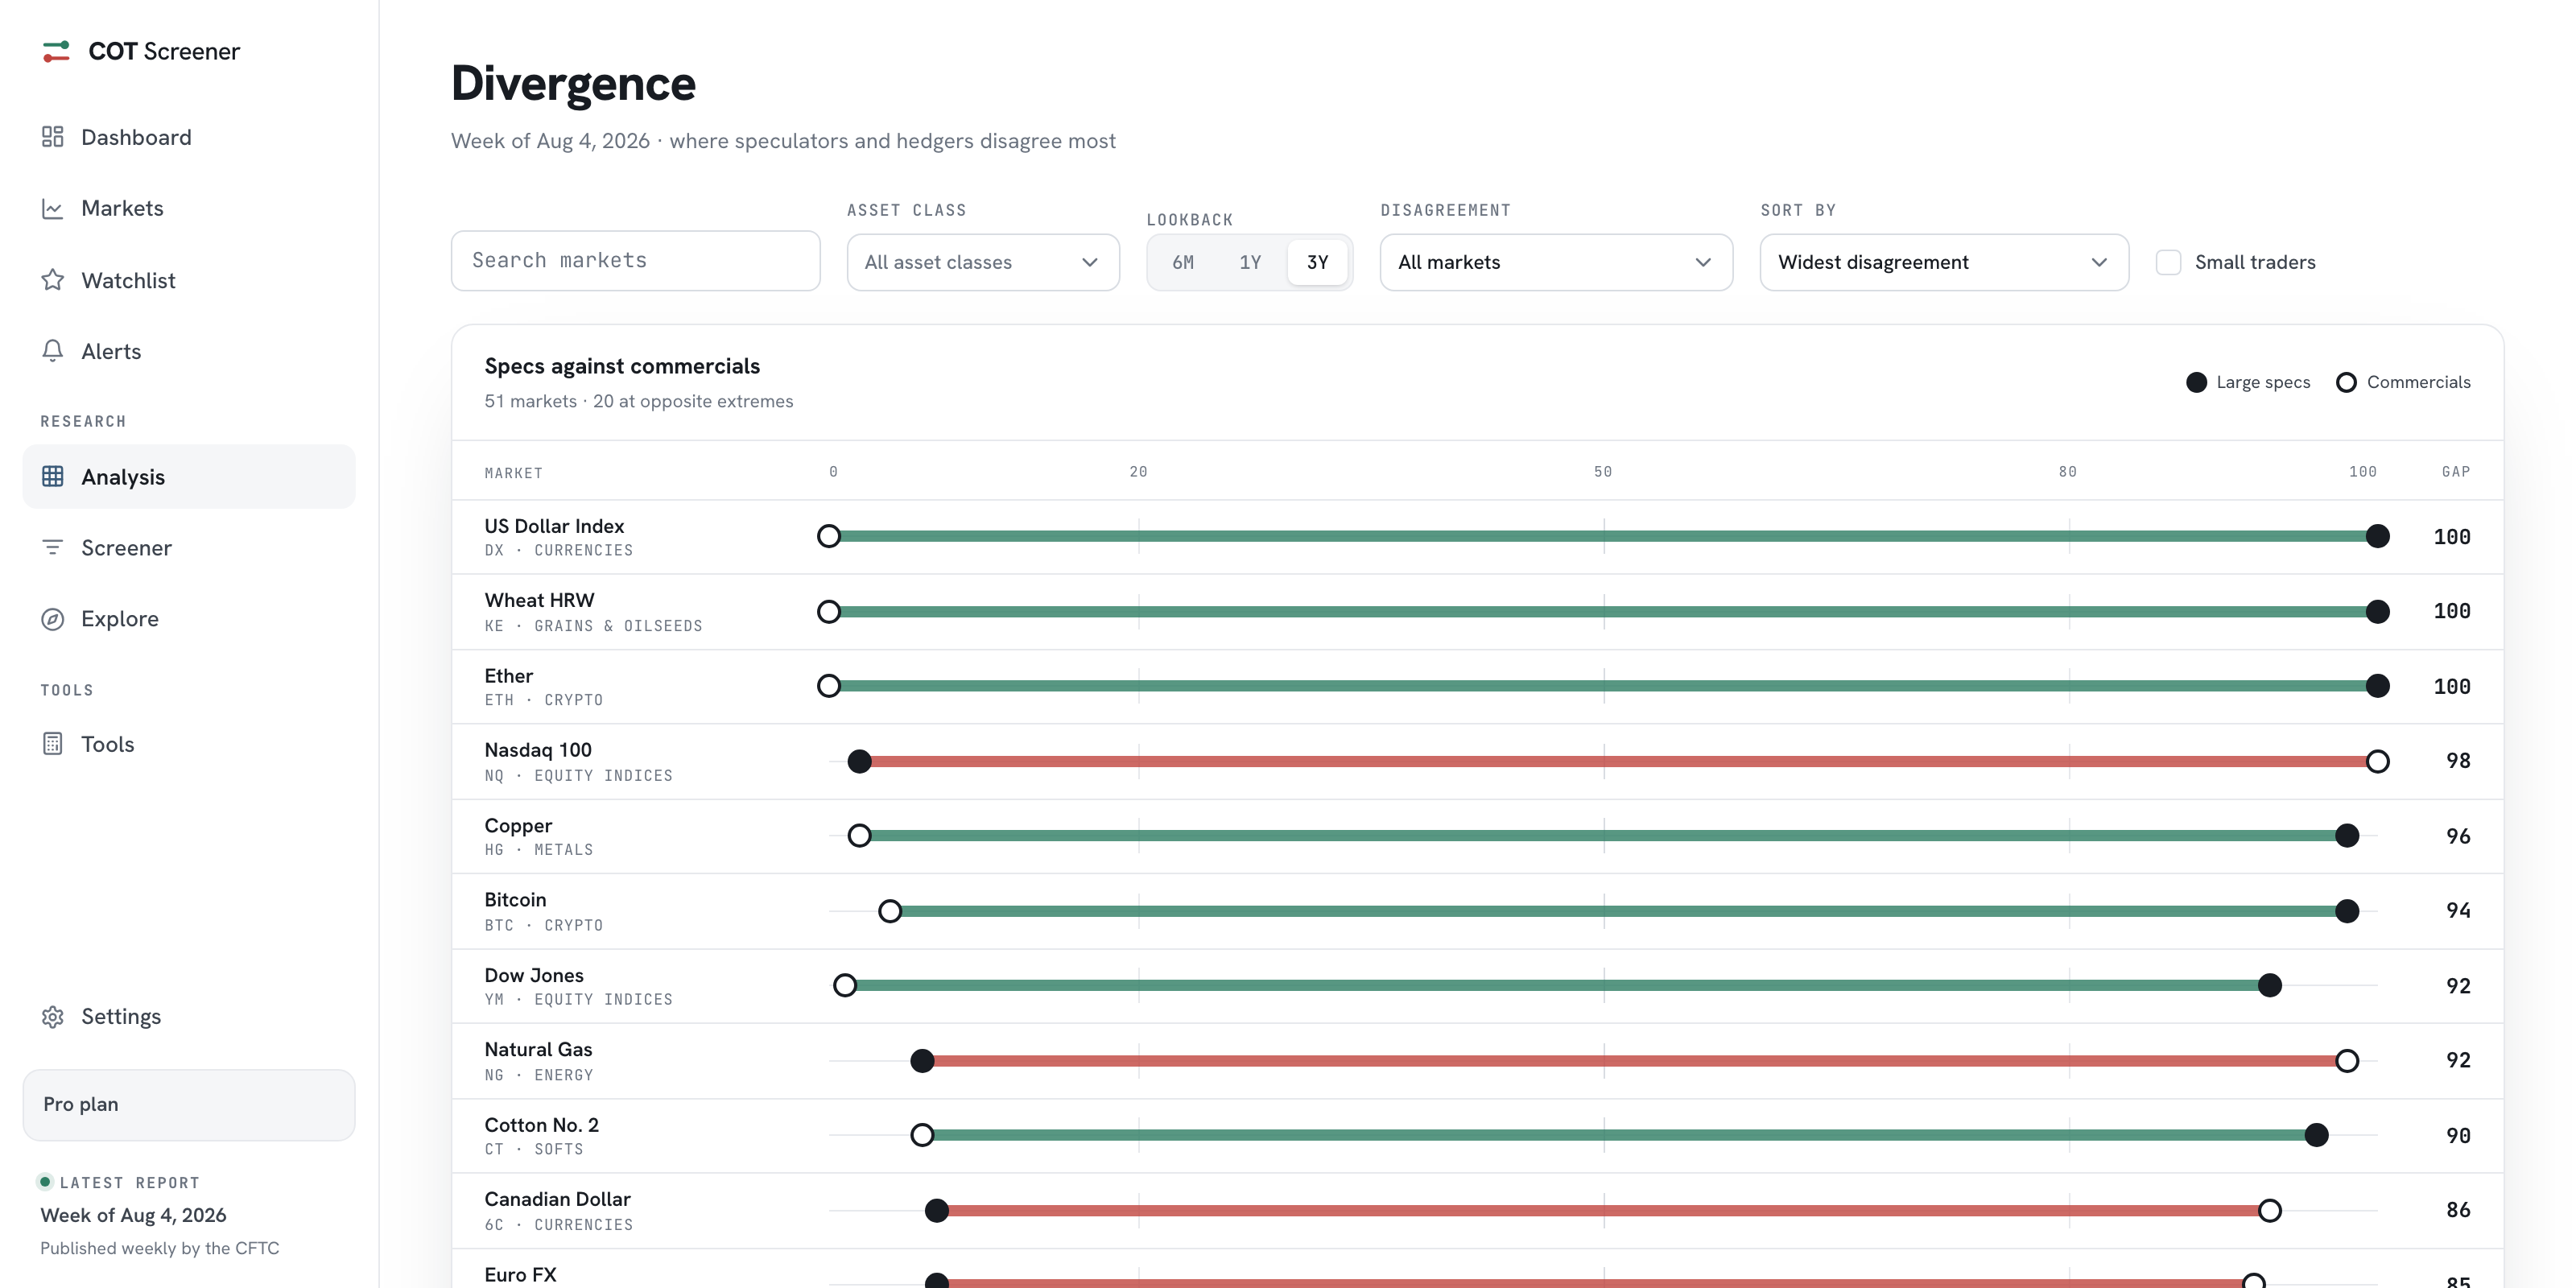
The last switch is Divergence only. It keeps markets where large speculators and commercials sit at opposite ends of the scale, one at 80 or above while the other is at 20 or below. That constellation gets a whole view of its own in the divergence article.
The table does the ranking
Seven columns cover the essentials. Market and asset class name the row. The COT Index column carries a small gauge, so a value reads as a position on the scale, not a bare number. Net position states the group’s long minus short in contracts. The weekly move column expresses the change as a share of open interest, which makes a 5,000-contract move in a small market comparable with one in a giant. Open interest and its weekly change complete the row.
Every header sorts. The default order is COT Index, descending, so the most stretched long positioning sits on top. Clicking a header again flips the direction.
A worked example
The screenshot shows one press of the Long extremes toggle. The range snaps to 80 through 100, and the count line reports what survived. In the week shown, that left 12 of 51 markets, led by readings of 100. From here, each row is one click from its full analysis, where the signal pills and history put the reading in context.
The empty state matters too. When no market passes, the table says so and offers to widen the range, lower the move threshold or drop the divergence filter. A screen that returns nothing is an answer as well.
Common questions
How is the screener different from the heatmap?
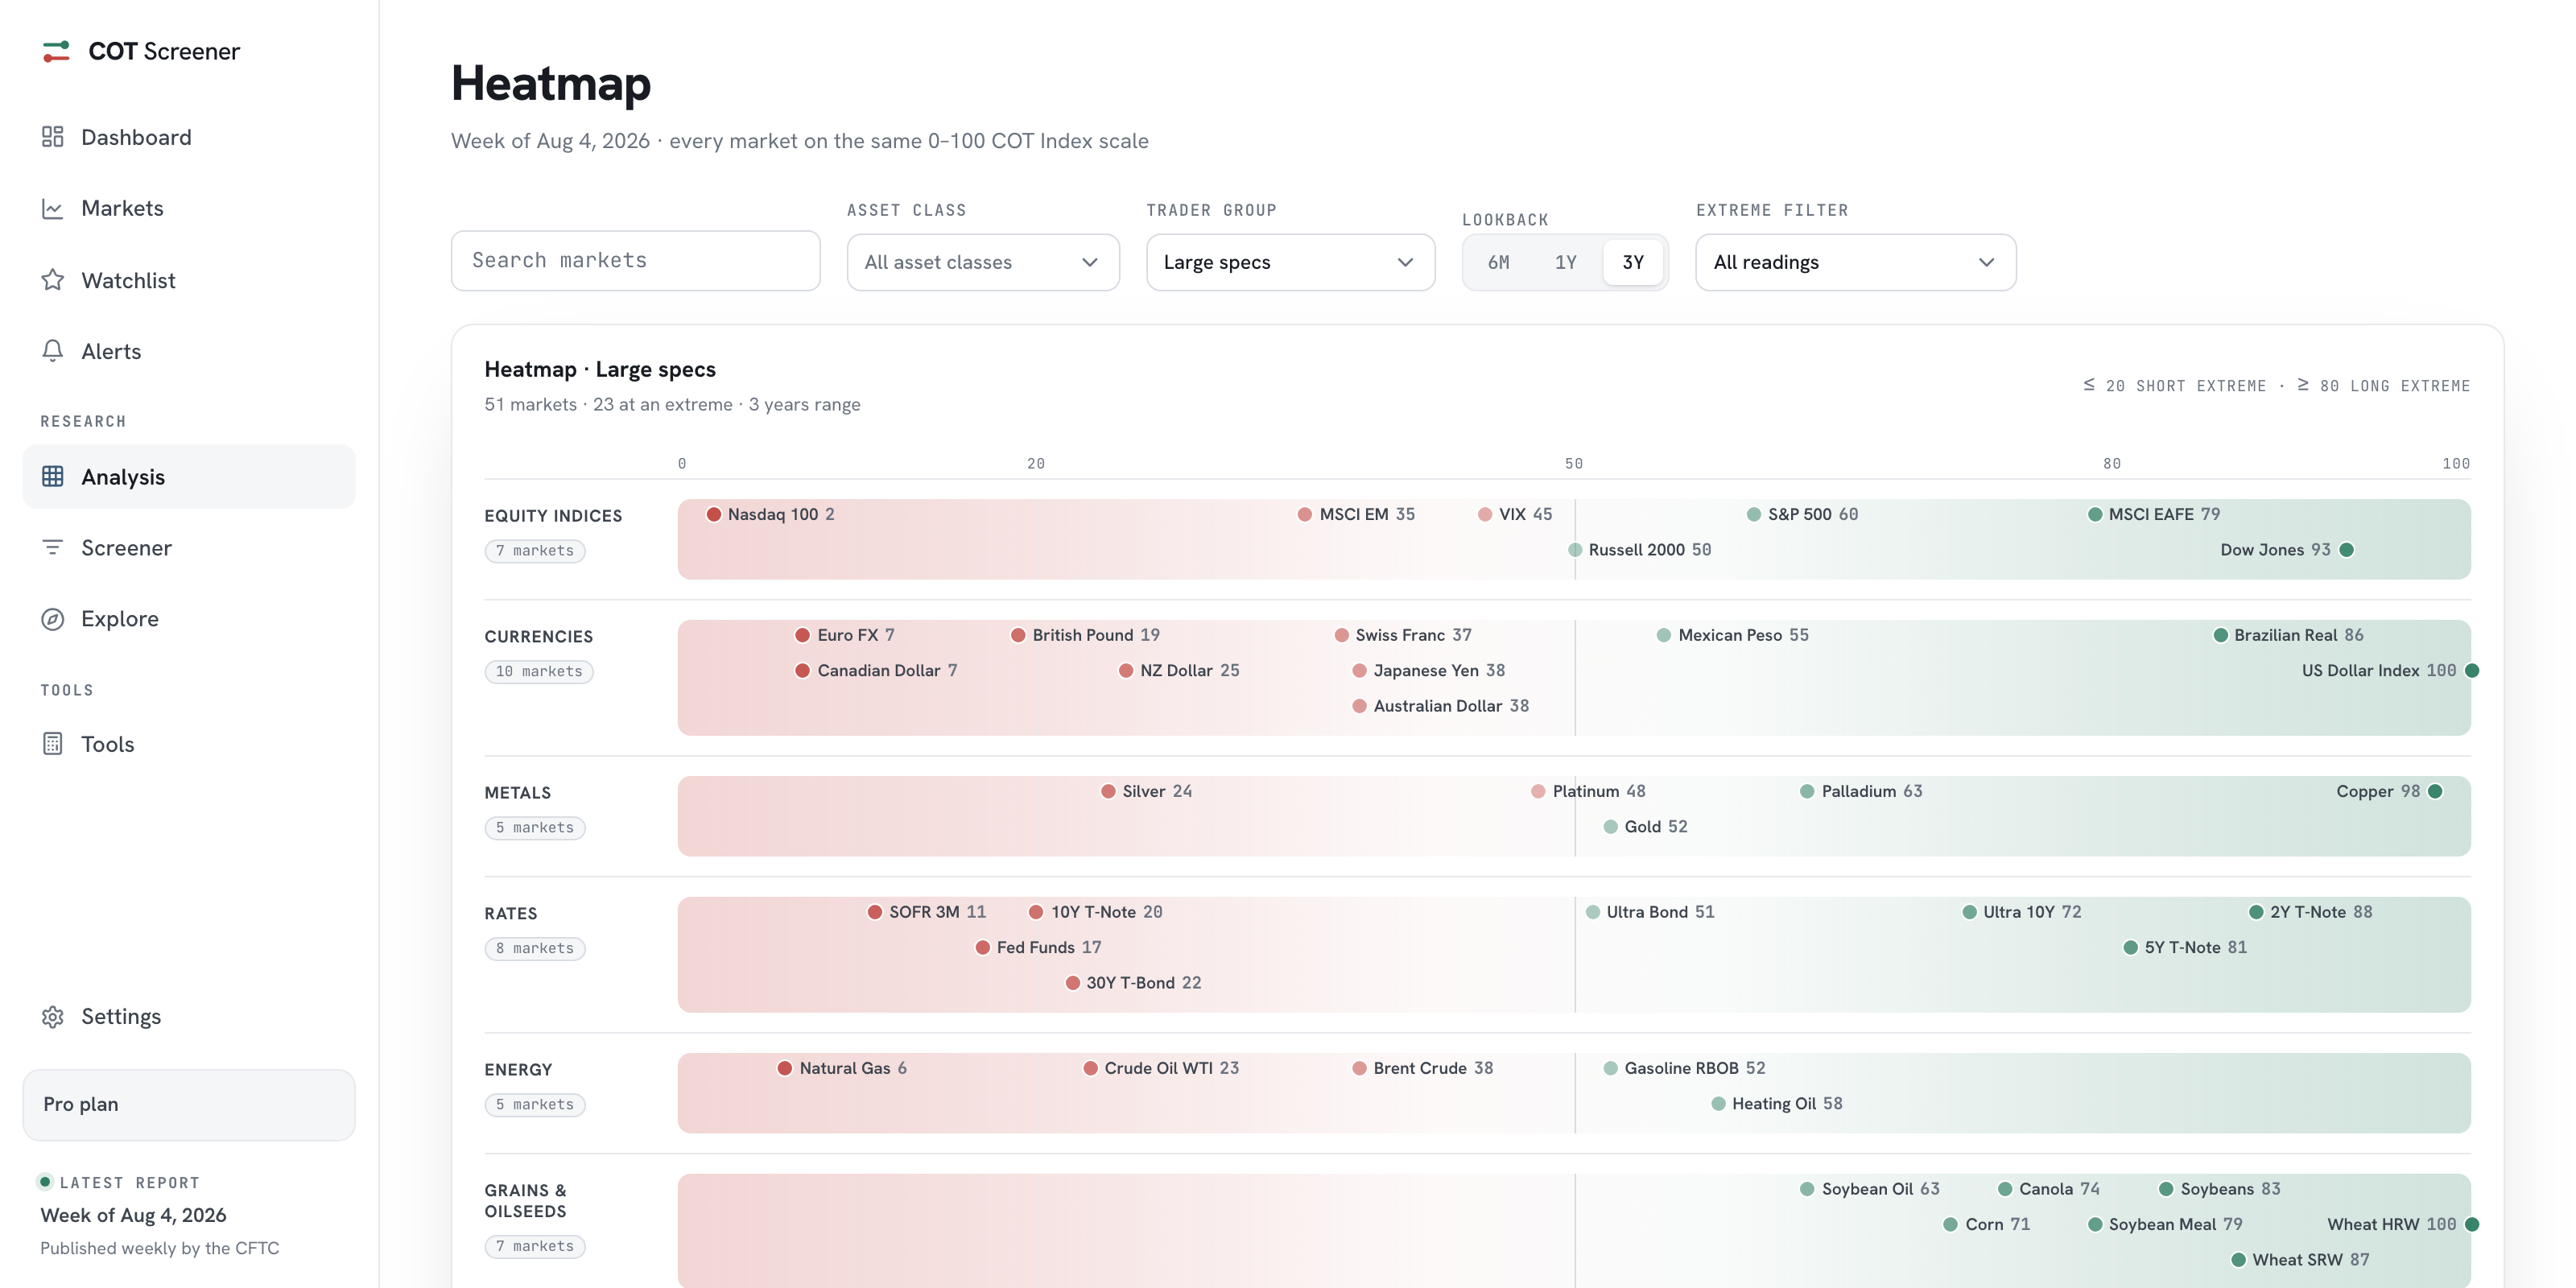
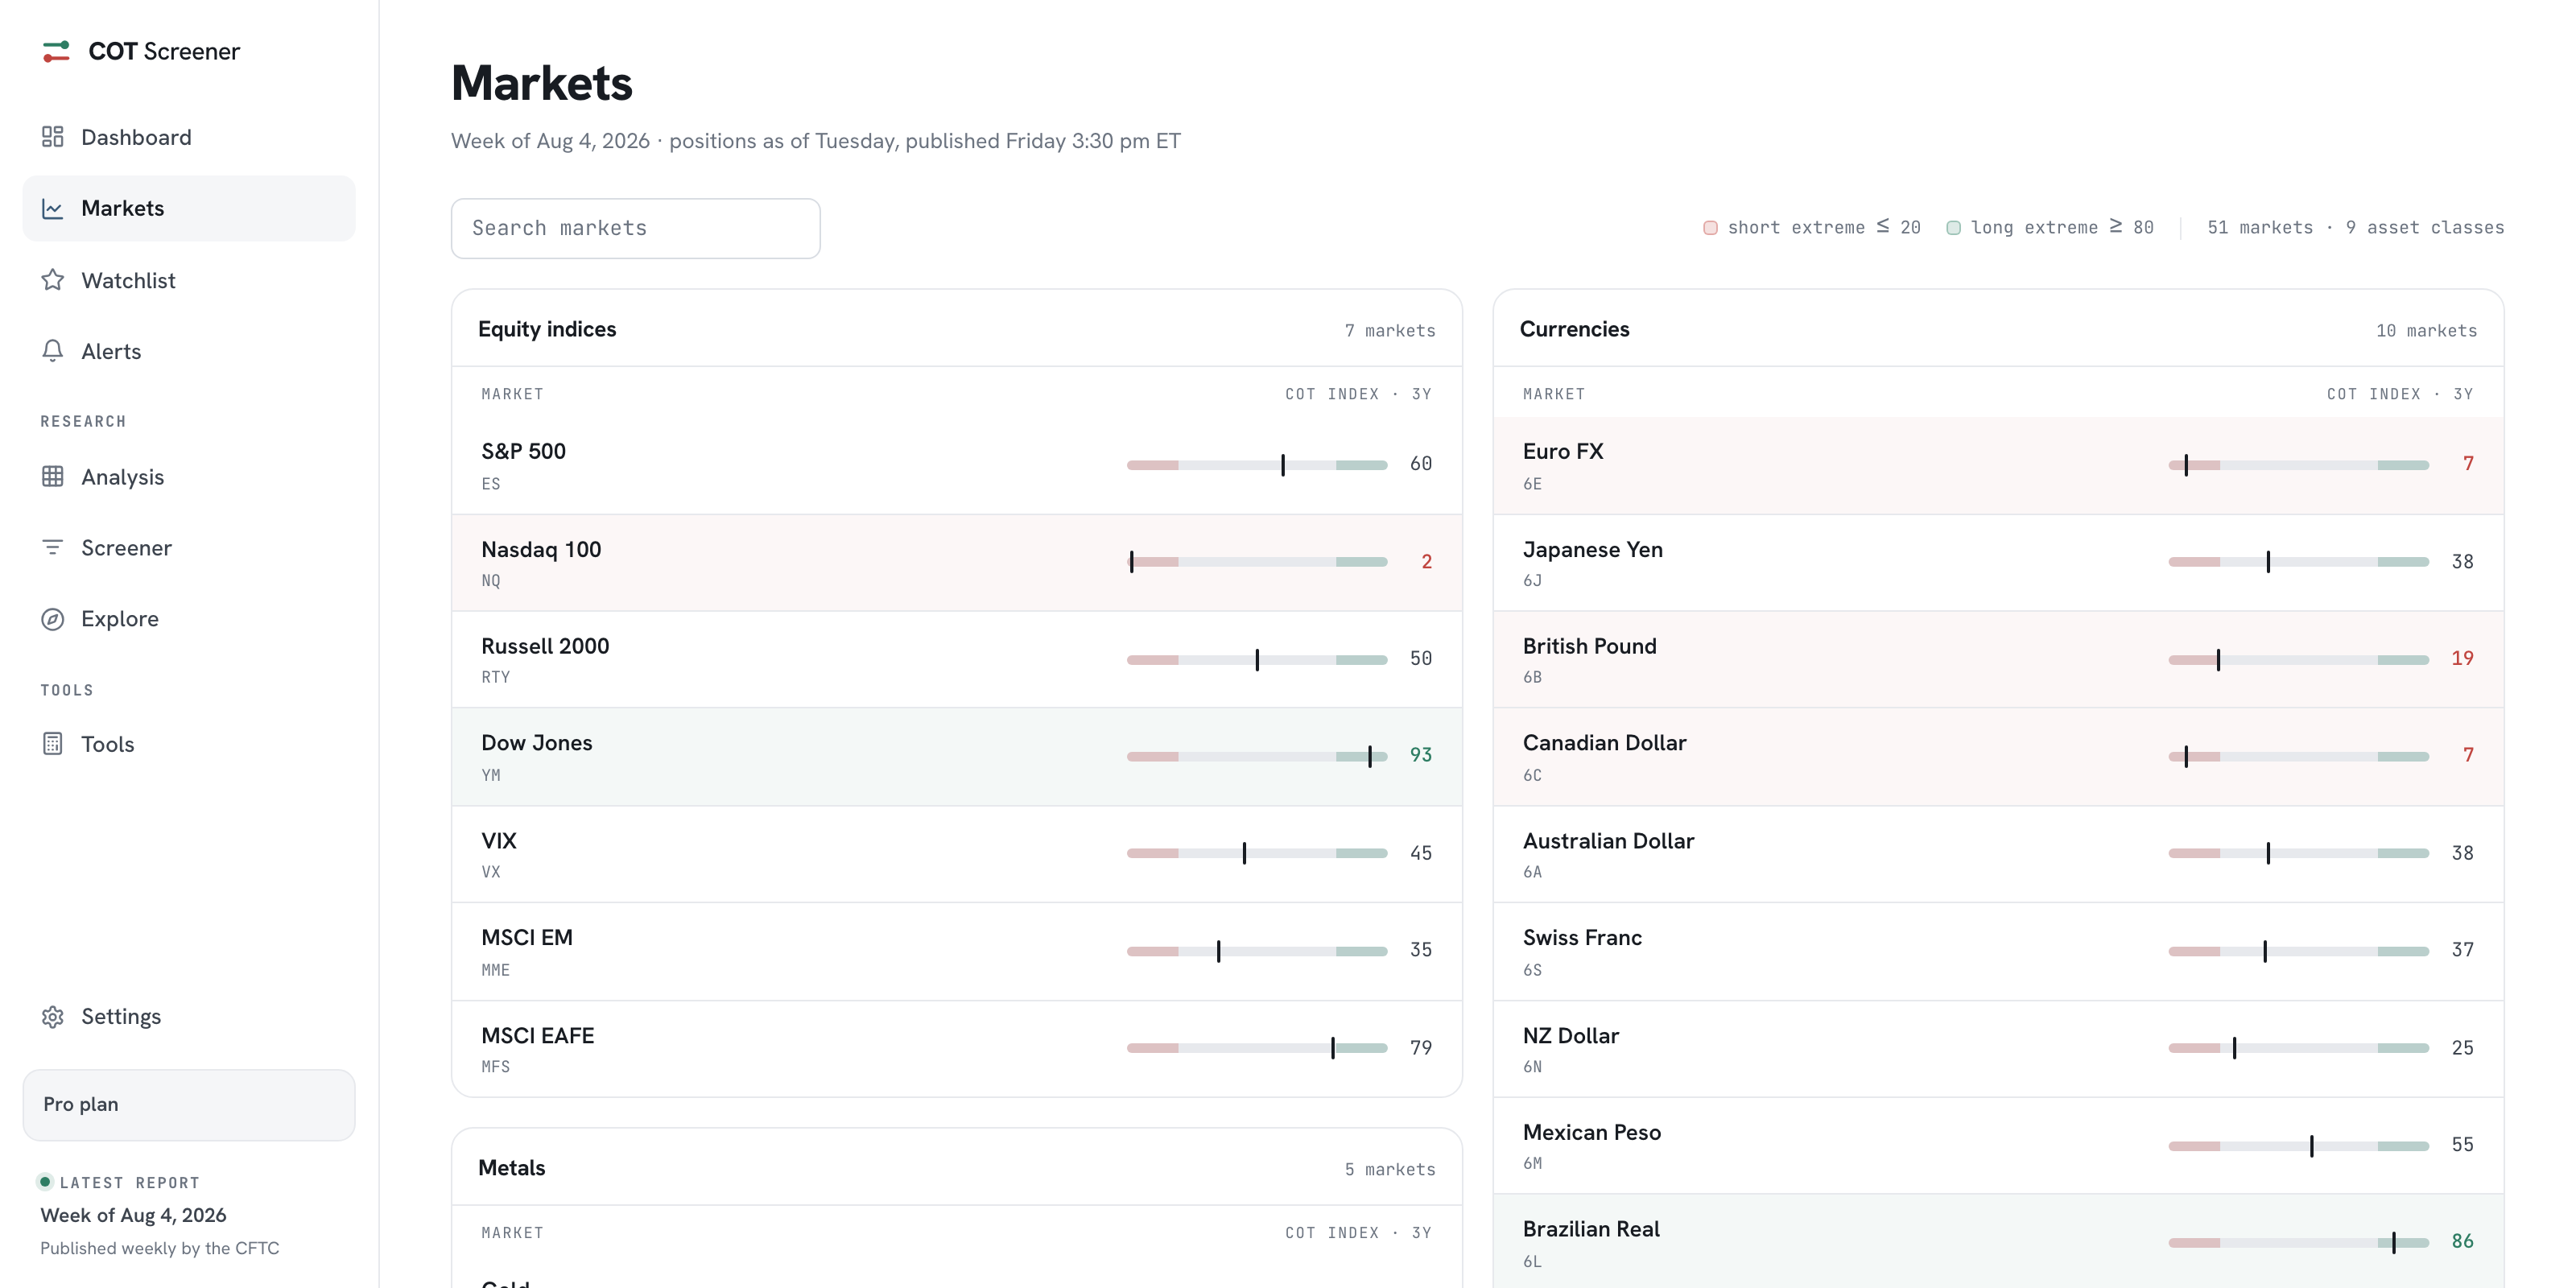
Same markets, opposite reading. The screener ranks and filters a table, which suits precise criteria. The heatmap draws every market on one axis, which suits a first scan. Many weeks start on the heatmap and end in the screener.
Which report does it use?
The Legacy futures-only report, for every market. Its three trader groups are what the columns and filters refer to. The report types guide explains what the other families add.
Can I share a screen I built?
Yes. Every filter lives in the page address, so copying the URL preserves the exact screen, and reloading or bookmarking it keeps your setup.
What does the Reset button touch?
Everything at once: scope, criteria and sorting go back to their defaults. It only lights up while something differs from the default state.