Inside COT Screener
Watchlist and alerts: the weekly routine
COT data changes once a week. That makes following it a routine, not a vigil. Two pages carry that routine: the watchlist holds what you follow, and alerts watch the levels you care about.
Both pages exist because of the same fact: the data is weekly. There is nothing to stare at between releases. So the app is built to be left, and these two pages are what greet you when you come back. The screenshots show the week of August 4, 2026, with a demonstration watchlist and three demonstration alerts.
The watchlist: your markets, minus the noise
The watchlist keeps three facts per market: its name, its COT Index on a small gauge, and the week’s net change for large specs and commercials. Rows sitting at an extreme are tinted, so the list flags itself. Each row opens the market’s full analysis, a bell sets an alert, and an X removes the market. Adding works from any market page’s Watchlist button.
Beside the watchlist sits the week’s recruitment list: every market at a COT Index extreme that is not already on your watchlist. It is deliberately complete rather than a top five, so a quiet week shows three candidates and a loud one shows twenty. One click on the plus moves a market from the rail onto your watchlist.
Alerts: a line in the sand
An alert is one sentence: trigger when this market’s COT Index rises above, or falls below, this level. The form builds it in three moves. Pick a market, pick a direction, drag the slider to the level. The slider’s track carries the extreme zones, and a preview line restates the rule in words before you save it.
Each saved alert becomes a card that answers its own question. The sentence restates the rule. The gauge places the current reading against your line, with the extreme zones shaded. The state label on the right says Waiting or Triggered. In the demonstration shown, a Gold alert set at 45 reads Triggered because the week landed at 52.
The routine, end to end
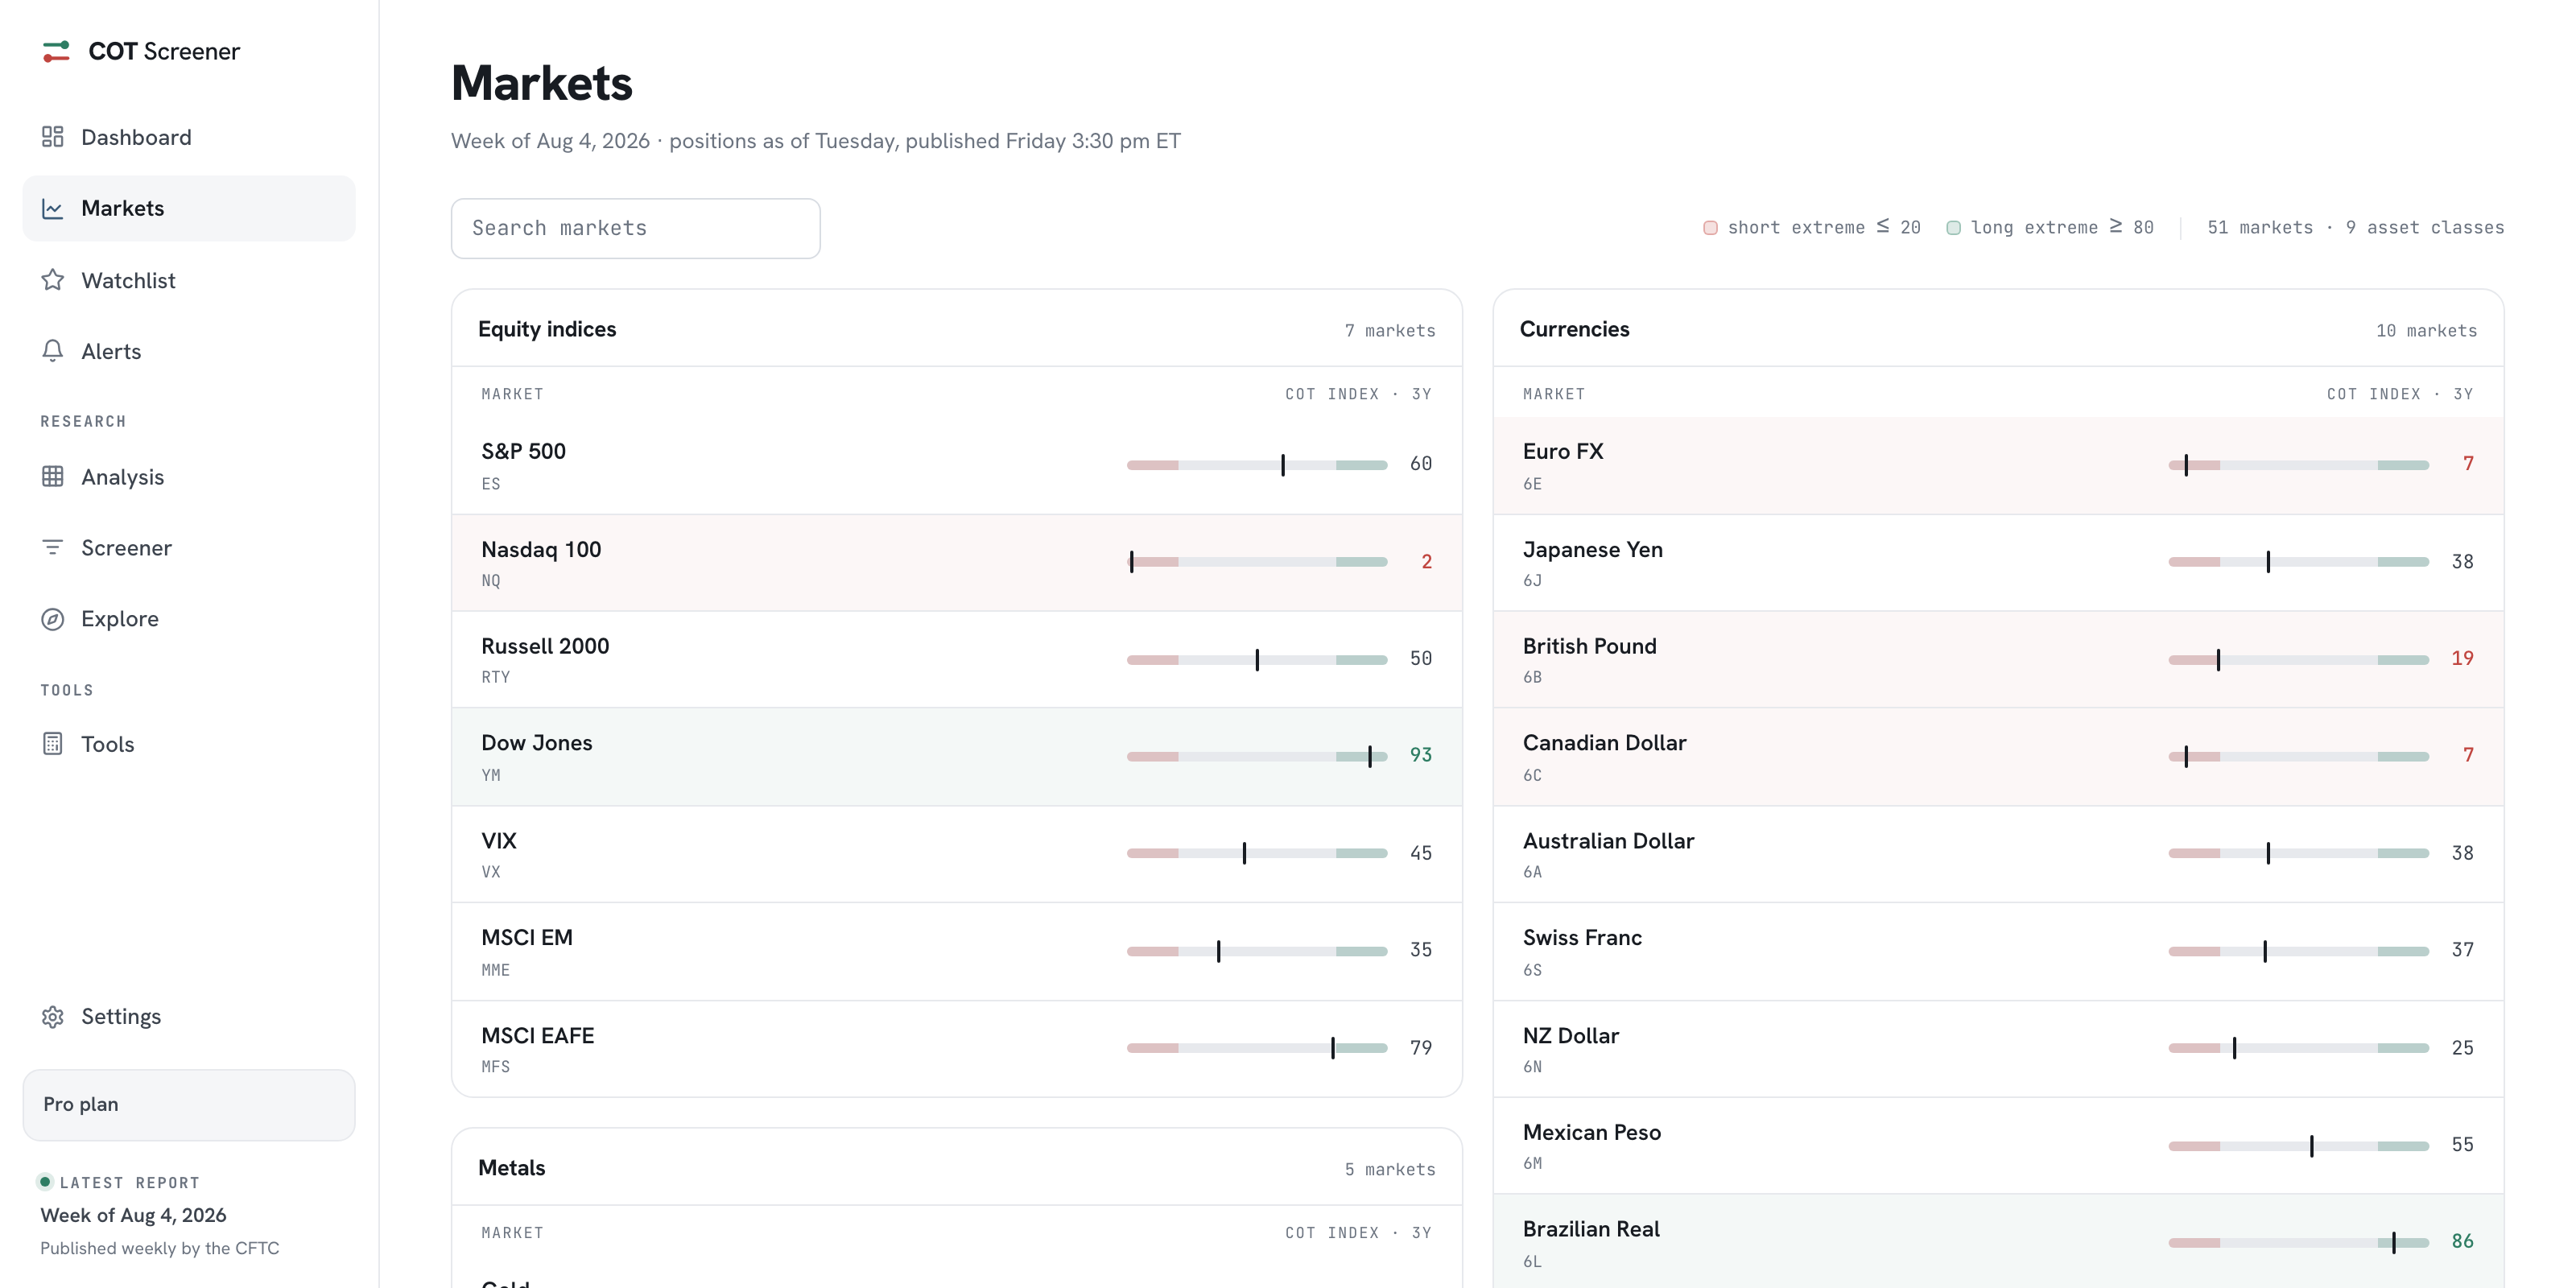
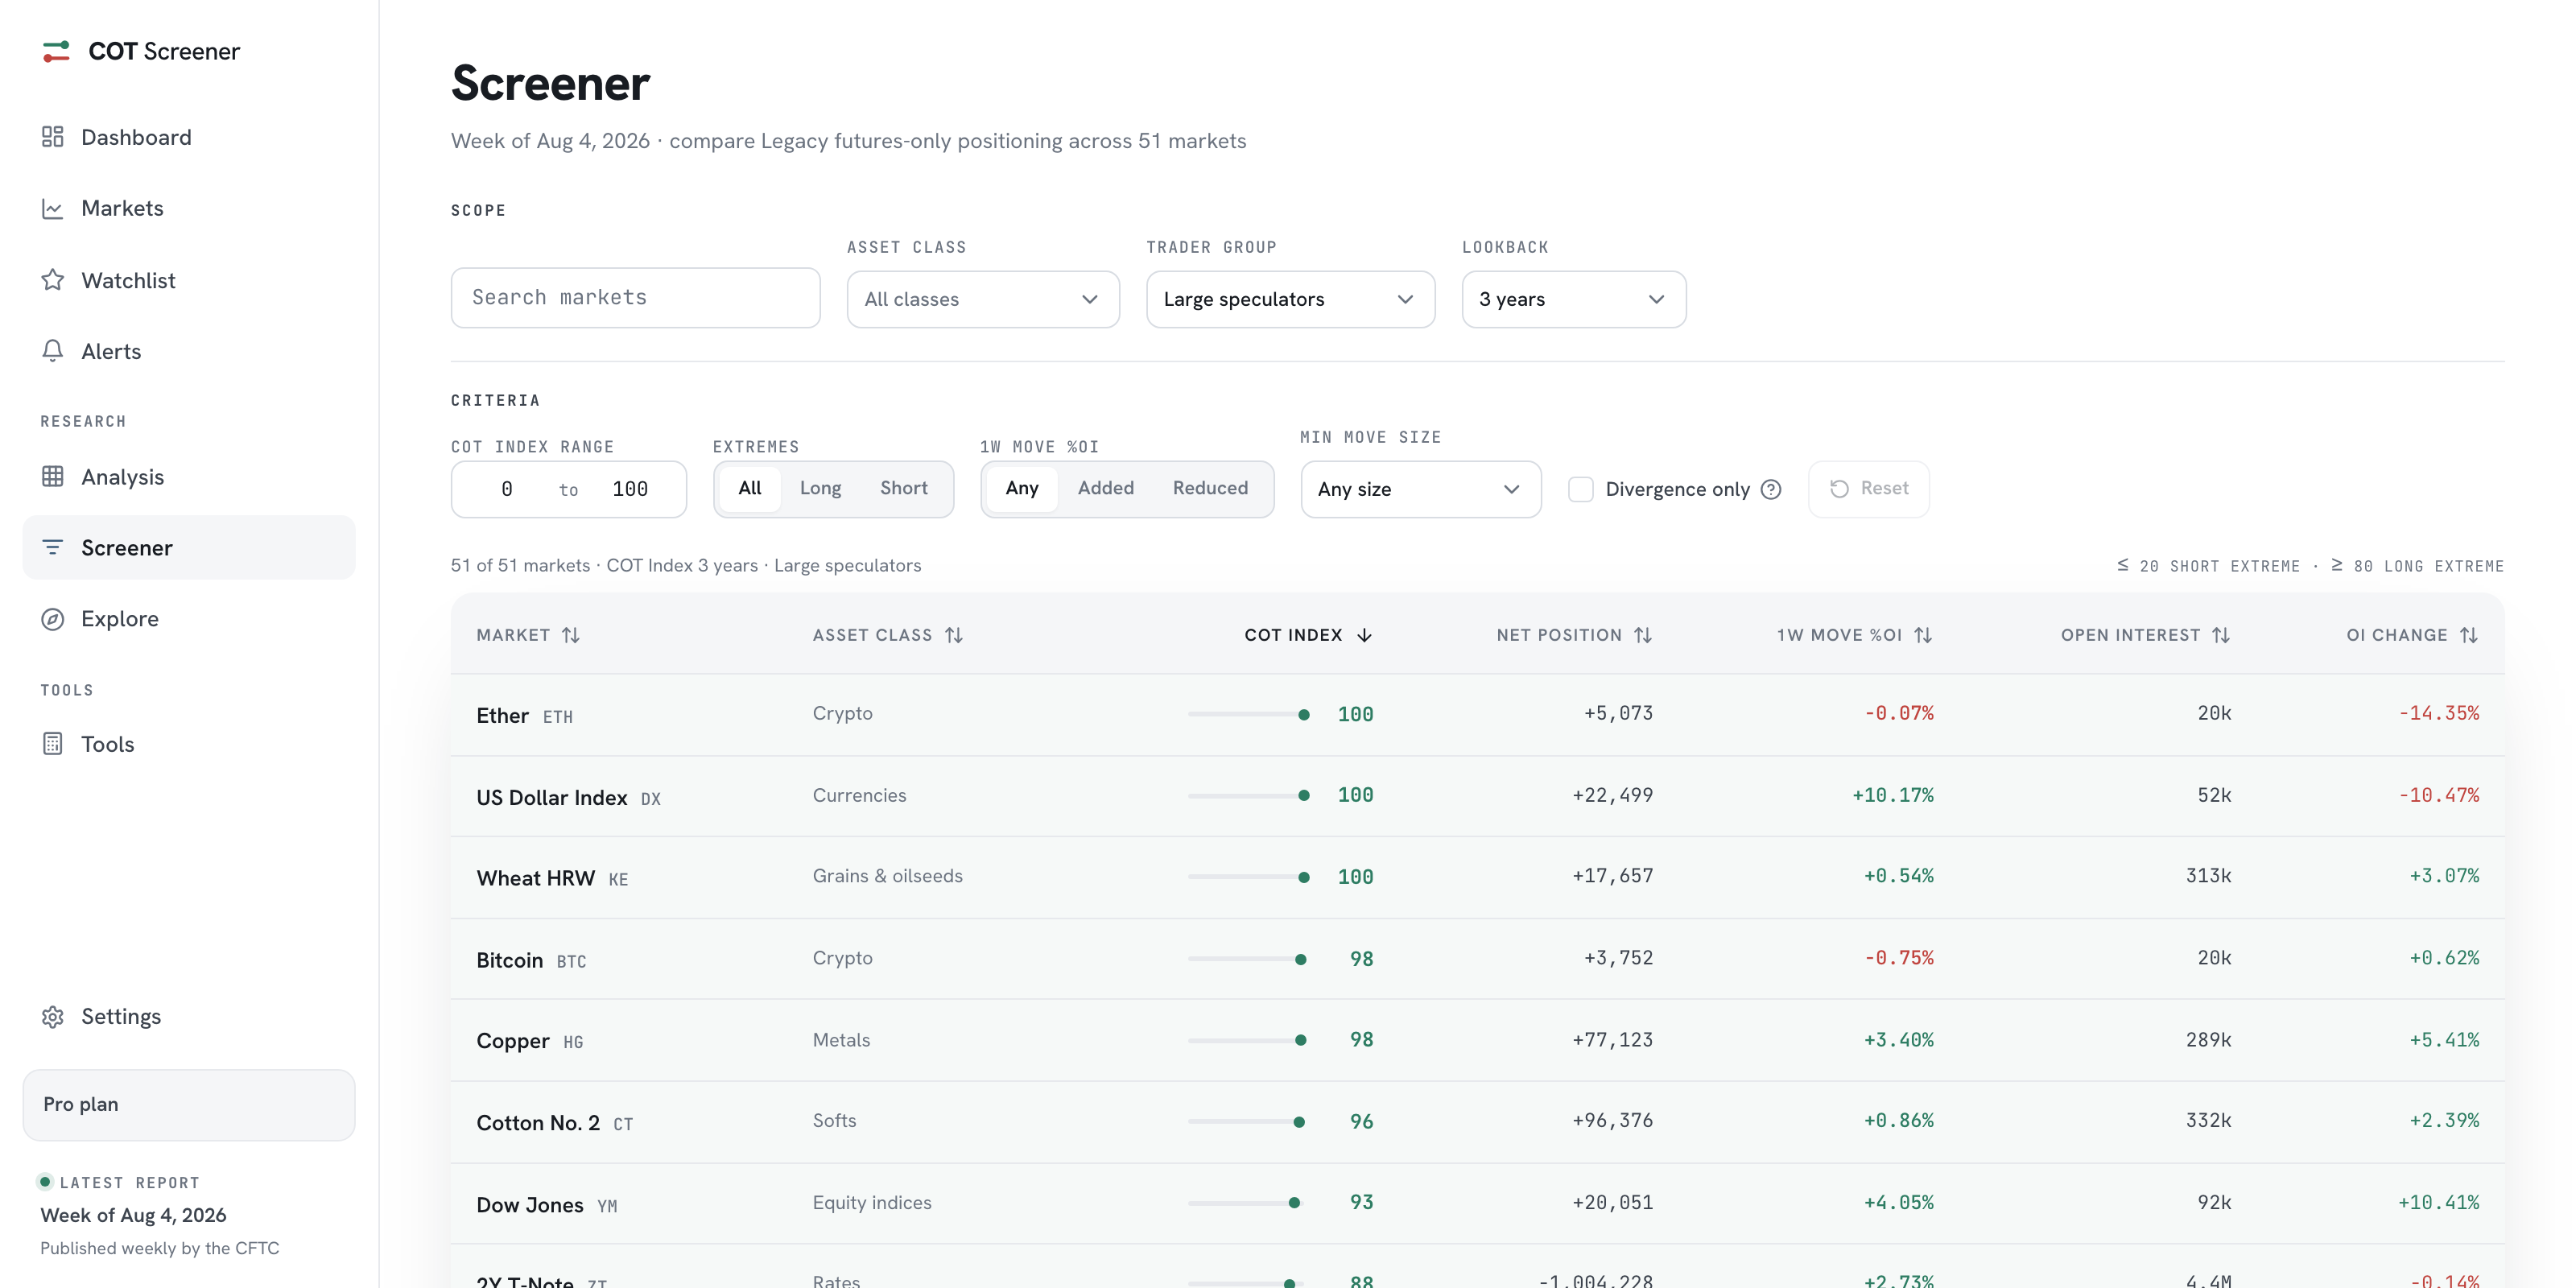
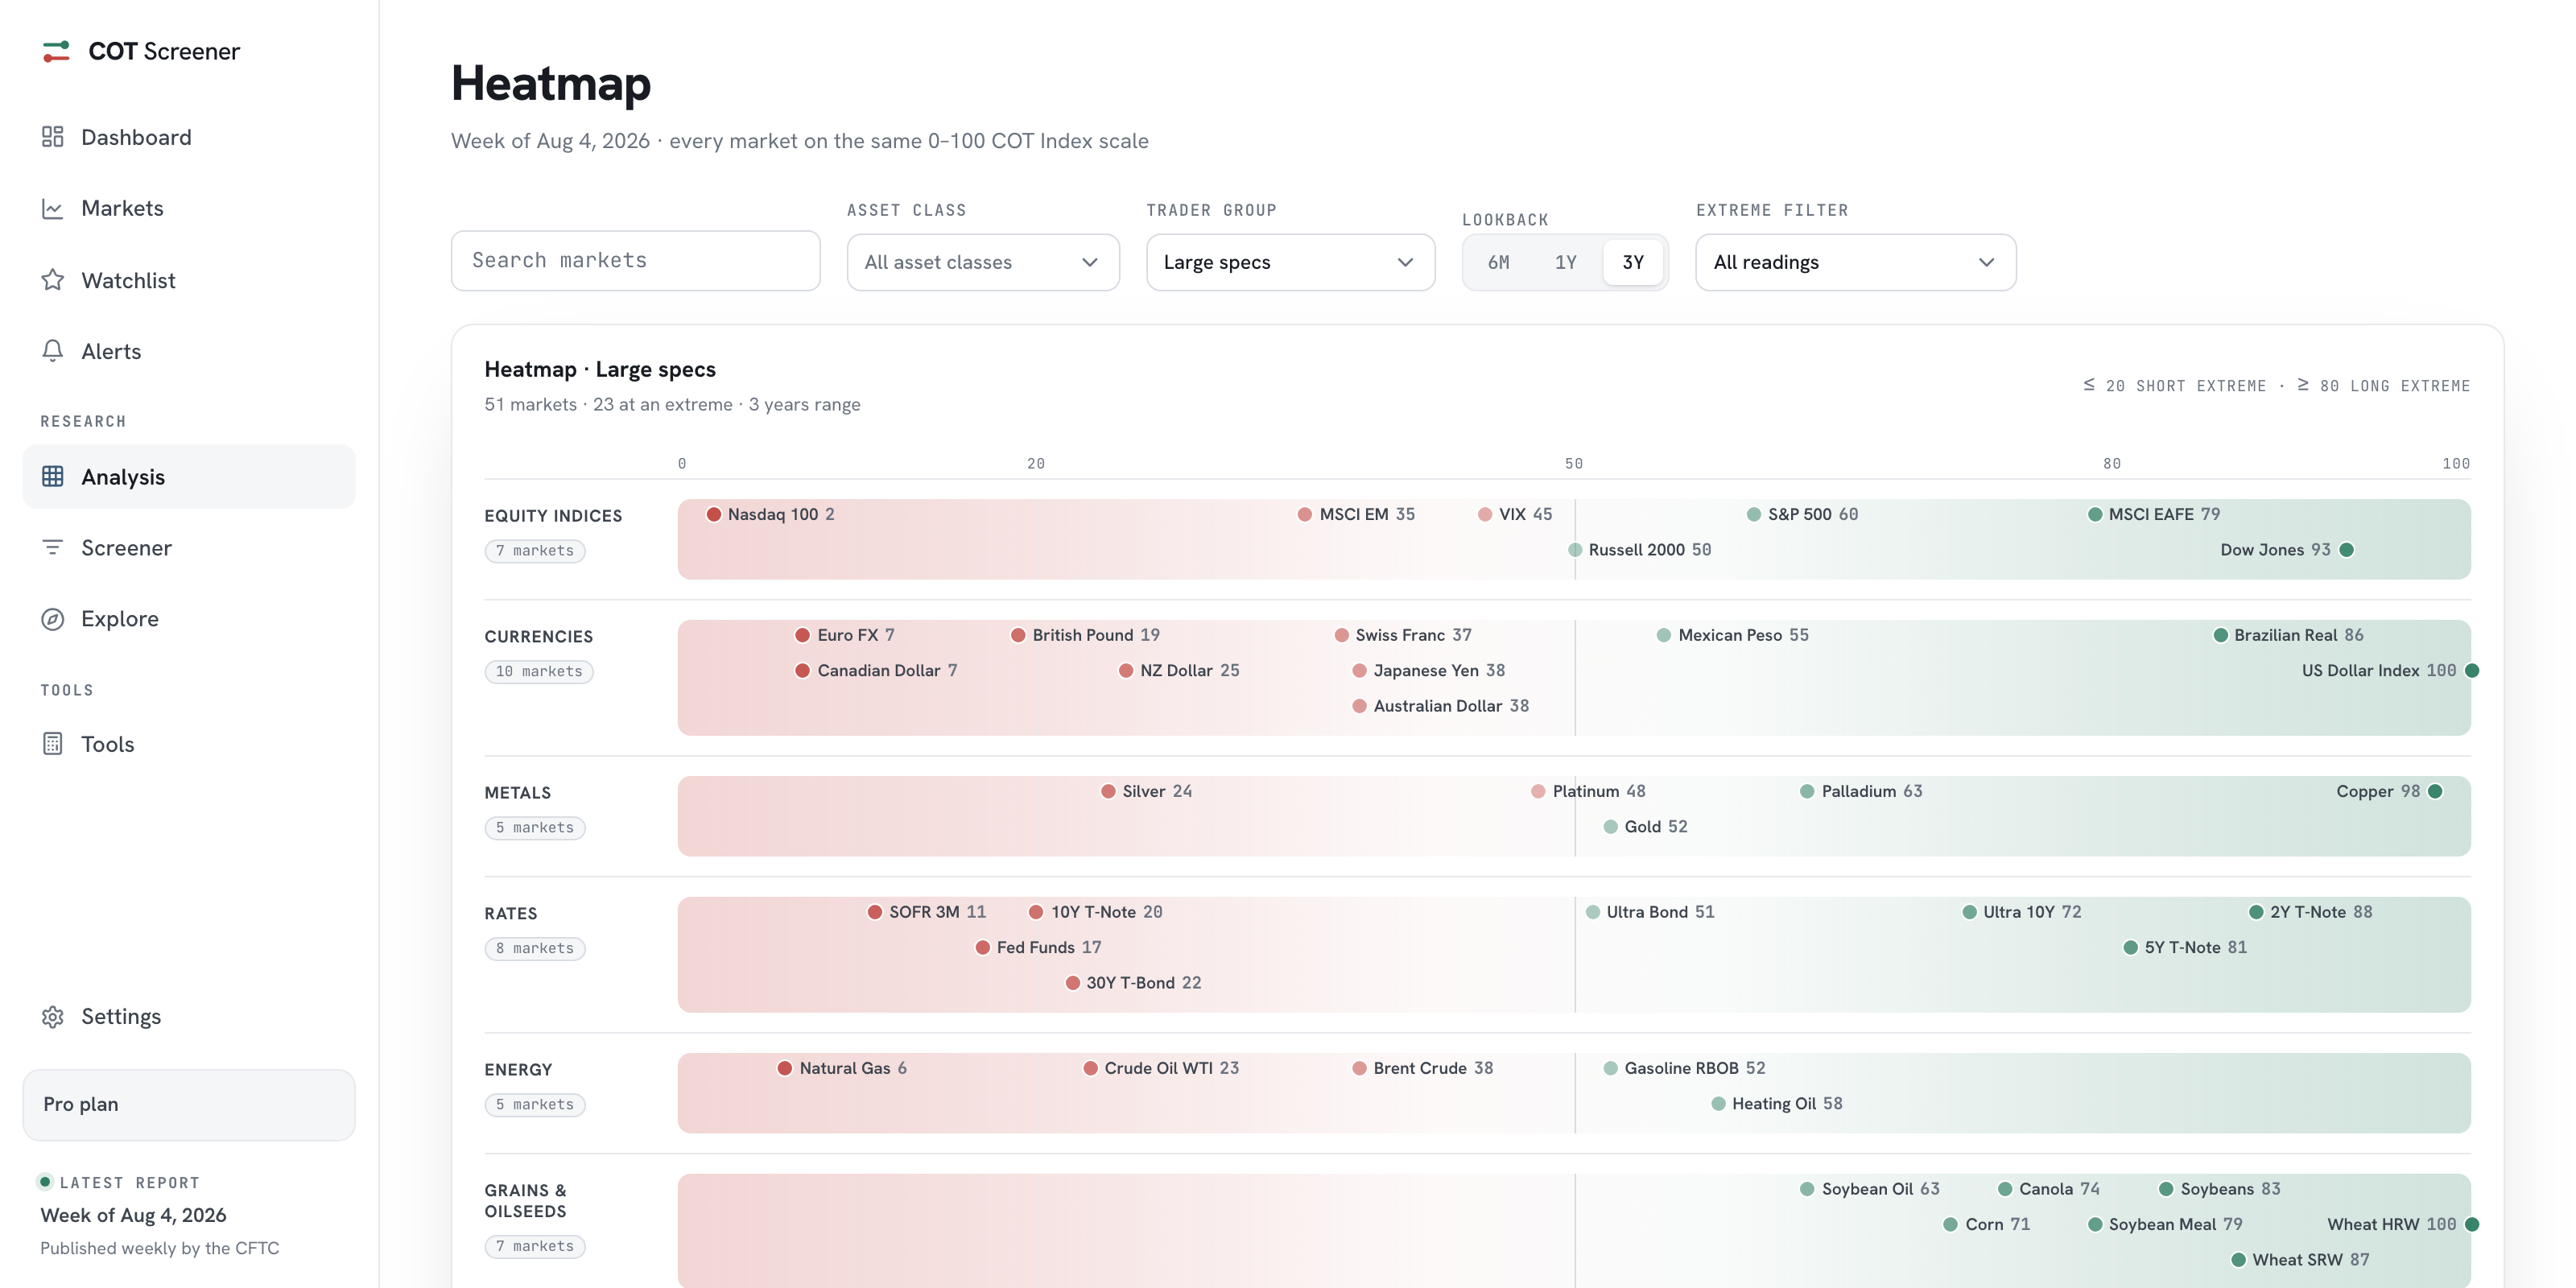
A week with this setup takes minutes. The release lands, the watchlist shows what moved on the markets you chose, and the alerts page shows which lines were crossed. Anything that needs depth is one click away in the market’s analysis. Finding the next market for the list is what the screener and the heatmap are for.
Common questions
How many markets and alerts can I add?
As many as you find useful. The pages are built for short lists you actually read, but nothing stops a long one.
Can I watch markets outside the majors?
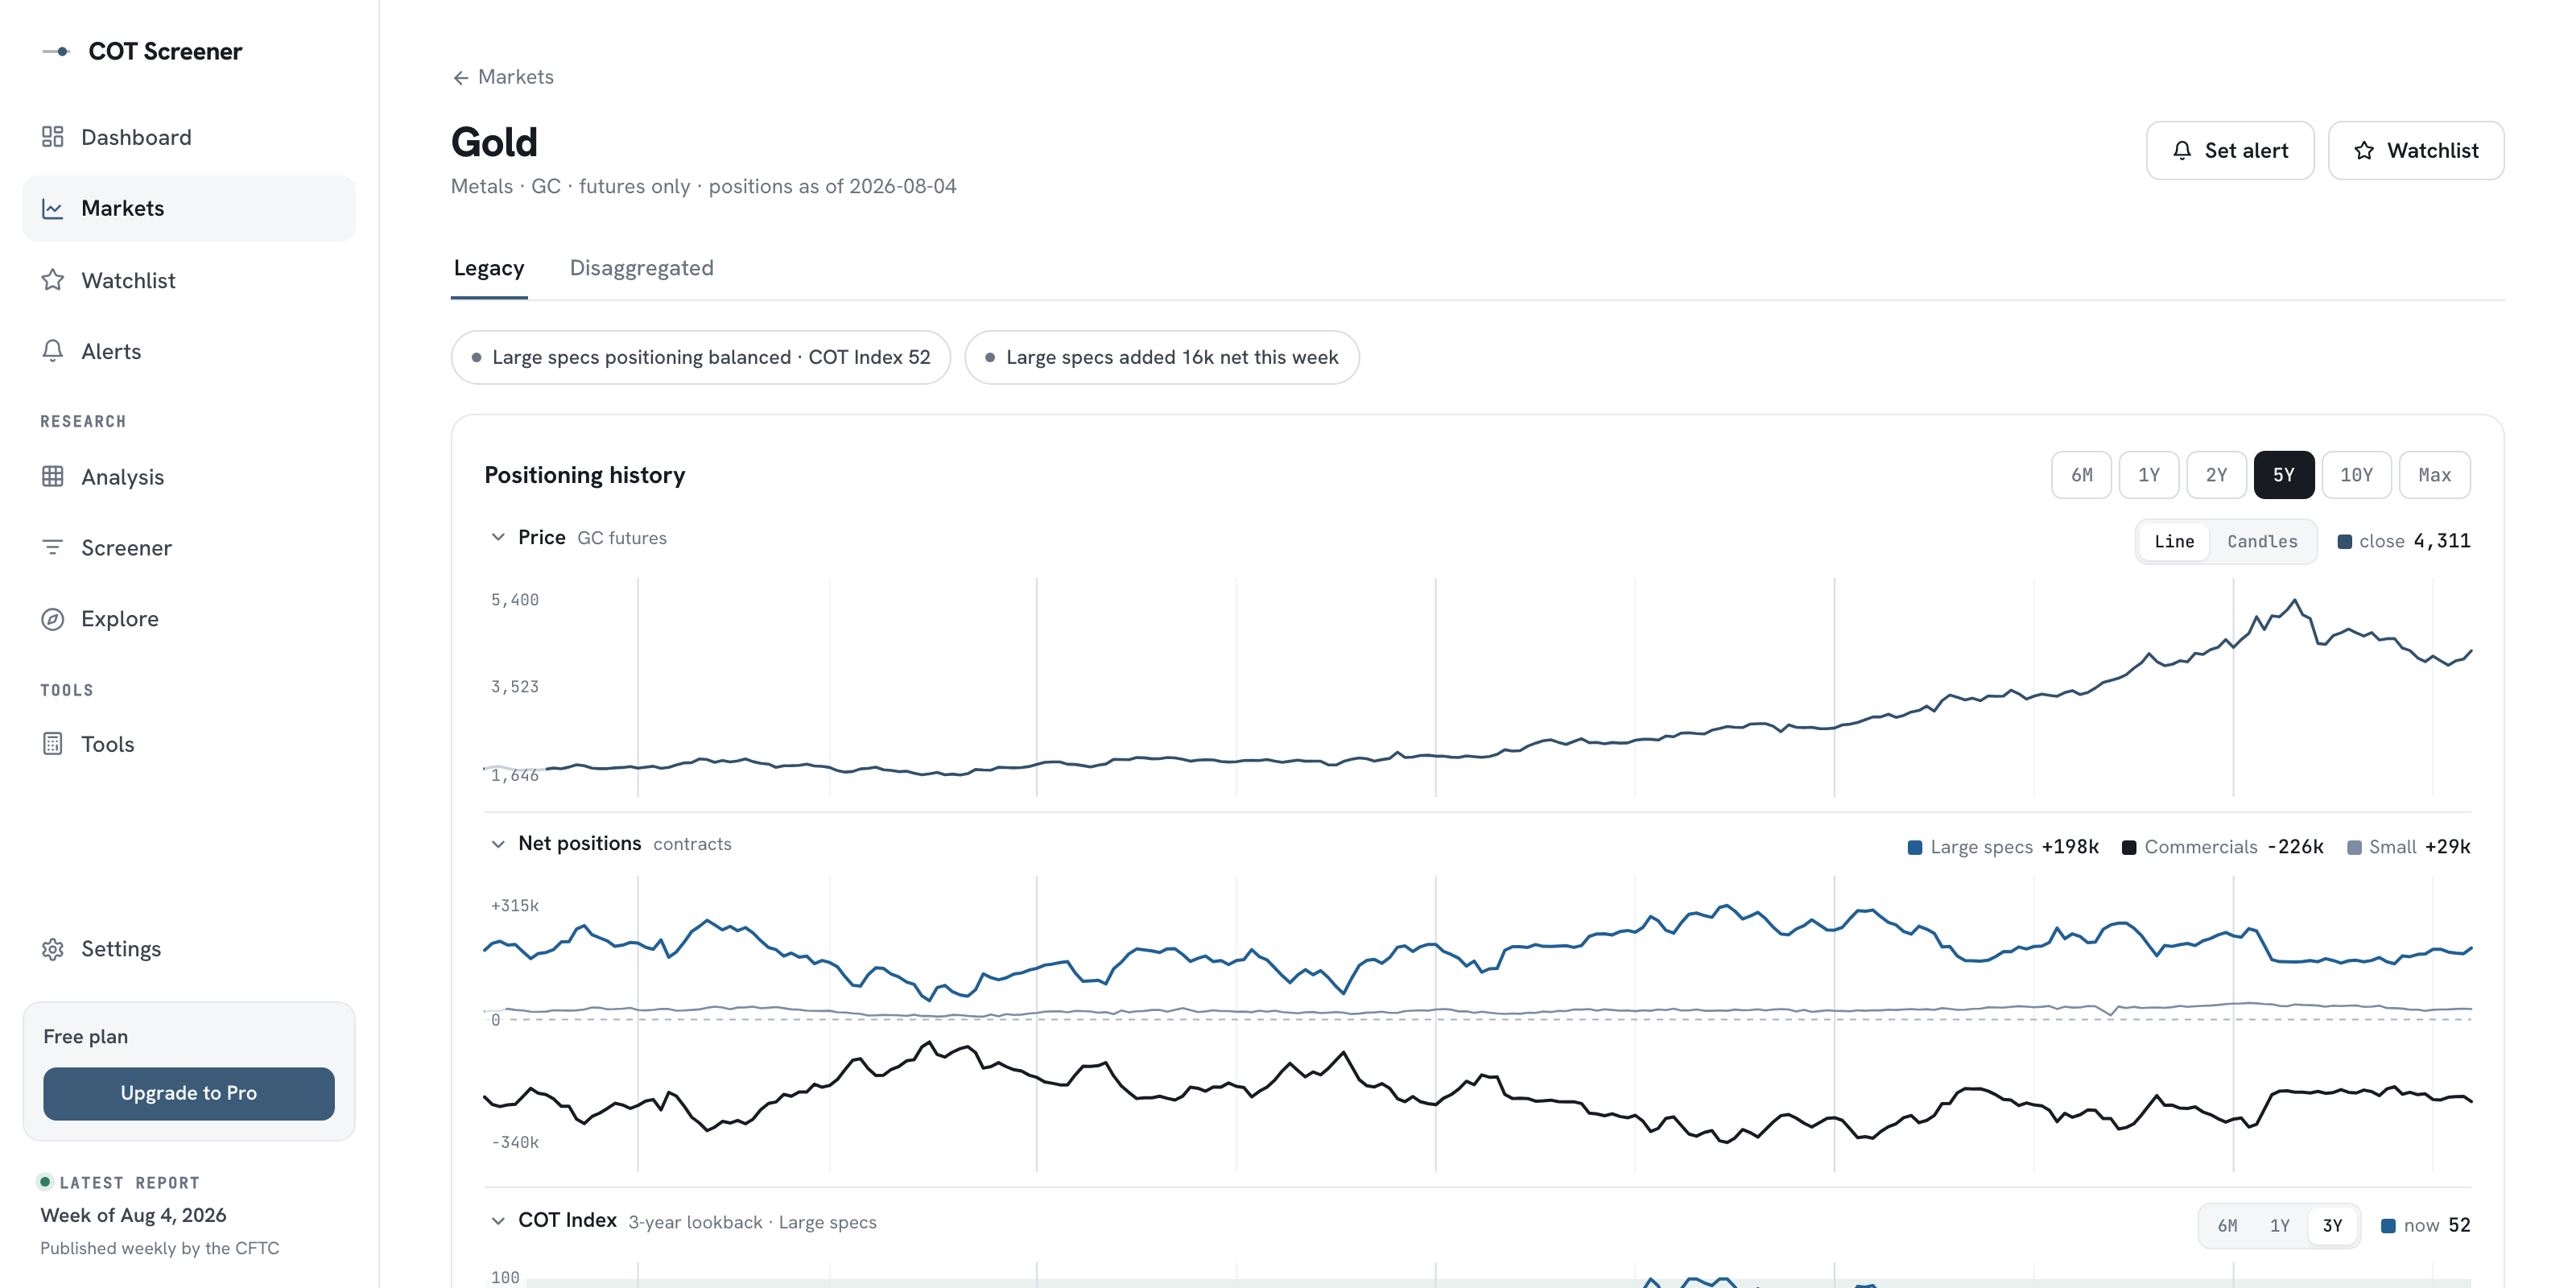
Yes. Every market in Explore opens the same analysis page, and its buttons add it to the watchlist or attach an alert. Only the alert form’s quick picker stays majors-only.
When do alerts update?
With the report itself. The CFTC publishes on Friday, the app ingests the release, and every trigger is checked against the new readings. The schedule guide covers the exact timing.
What does Triggered mean on a card?
The current reading is past your line: at or above it for a rises-above alert, at or below for falls-below. It stays visible instead of vanishing, so you can see the state at a glance.